New in Early: Home Dashboard, Outcome Report, and Usage Report
A daily view of release risk, analysis freshness, finding outcomes, and verification activity.
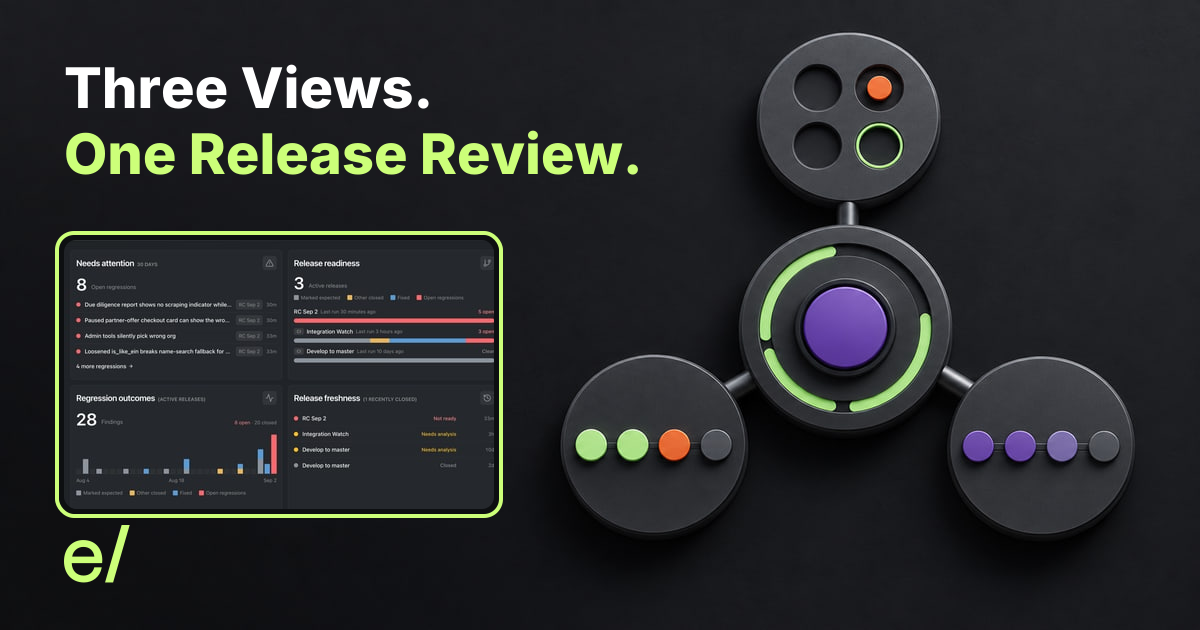
Early Regression Guard now brings release verification into three connected views: a Home dashboard for the daily overview, an Outcome report for regression findings and their current outcomes, and a Usage report for the analysis activity behind the review.
A release review should not begin by reconstructing evidence from individual runs. The first questions are broader. What risk is still open? What has already been fixed or closed? Is the analysis behind this release still current? And what verification activity produced the results being reviewed?
The new dashboard and reports give each question a clear place to start.
Start with the daily release overview
The Home dashboard brings four signals together for the team’s operational reporting window.
Needs attention lists open regressions that still require a decision or a fix. Release readiness summarizes finding outcomes for active release candidates. Regression outcomes shows the current outcome mix of findings across active releases. Release freshness shows whether the analysis supporting a release is current or whether another analysis is needed.
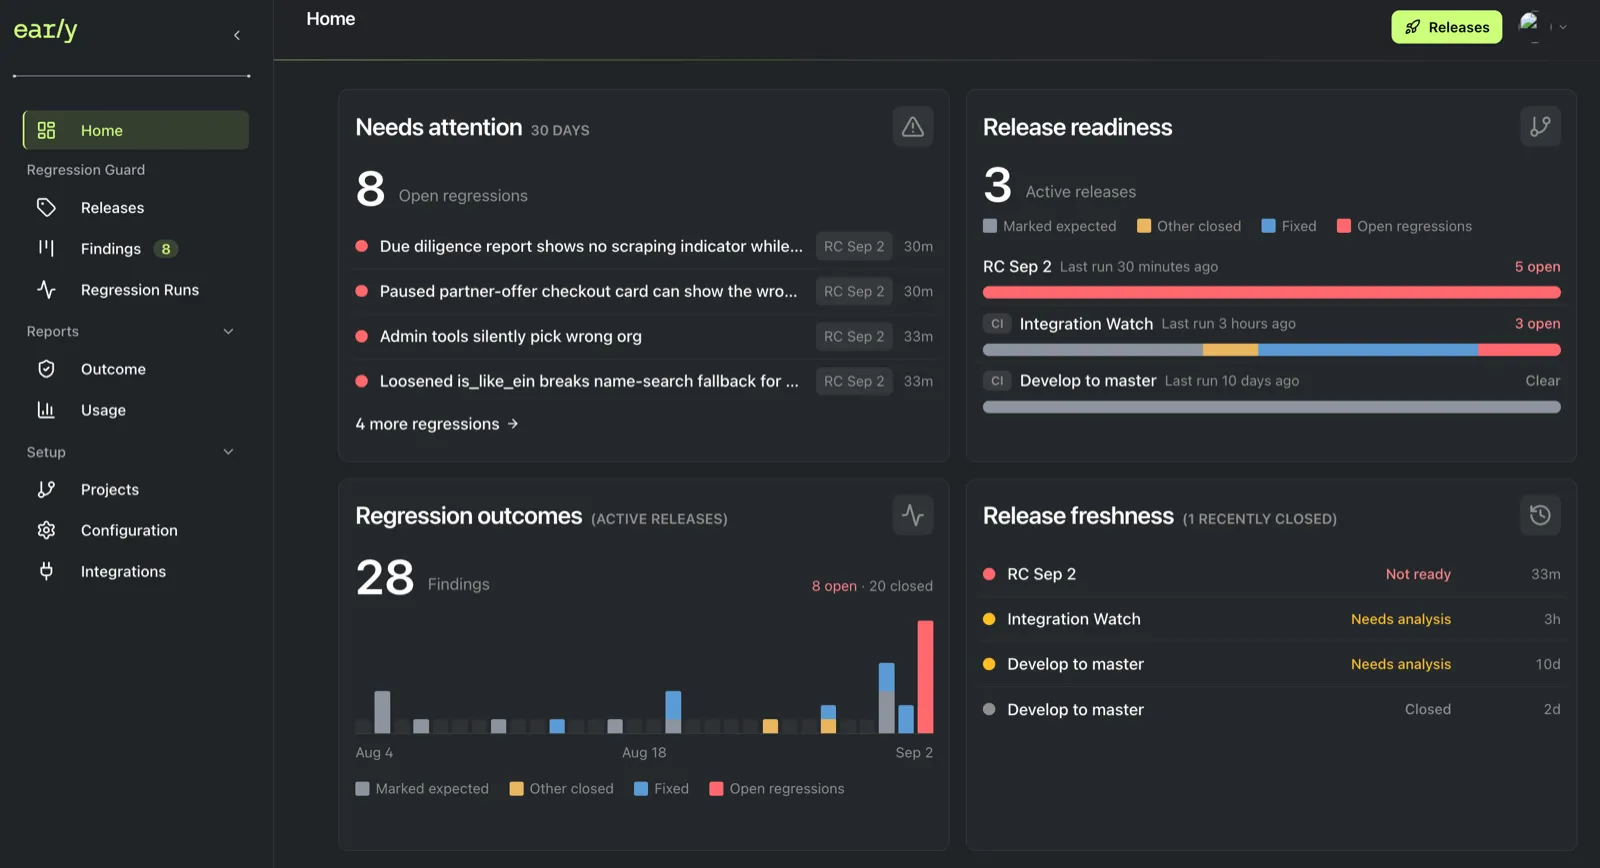
Example workspace showing the four Home dashboard panels.
Together, these panels answer a practical first question: where should the release conversation begin?
An active release with no open regressions in the readiness view is clearer to review than one with unresolved findings. That is still only part of the decision. The latest run time and freshness state matter because an older result may no longer represent the current release candidate.
The dashboard uses the team’s Operational reporting window. Teams can change that fixed period under Configuration, then Team setup, so the dashboard panels use the same time context.
Review findings and their current outcomes
The Outcome report is the deeper view of release risk. It shows findings produced by runs in the selected period, grouped by their current outcome.
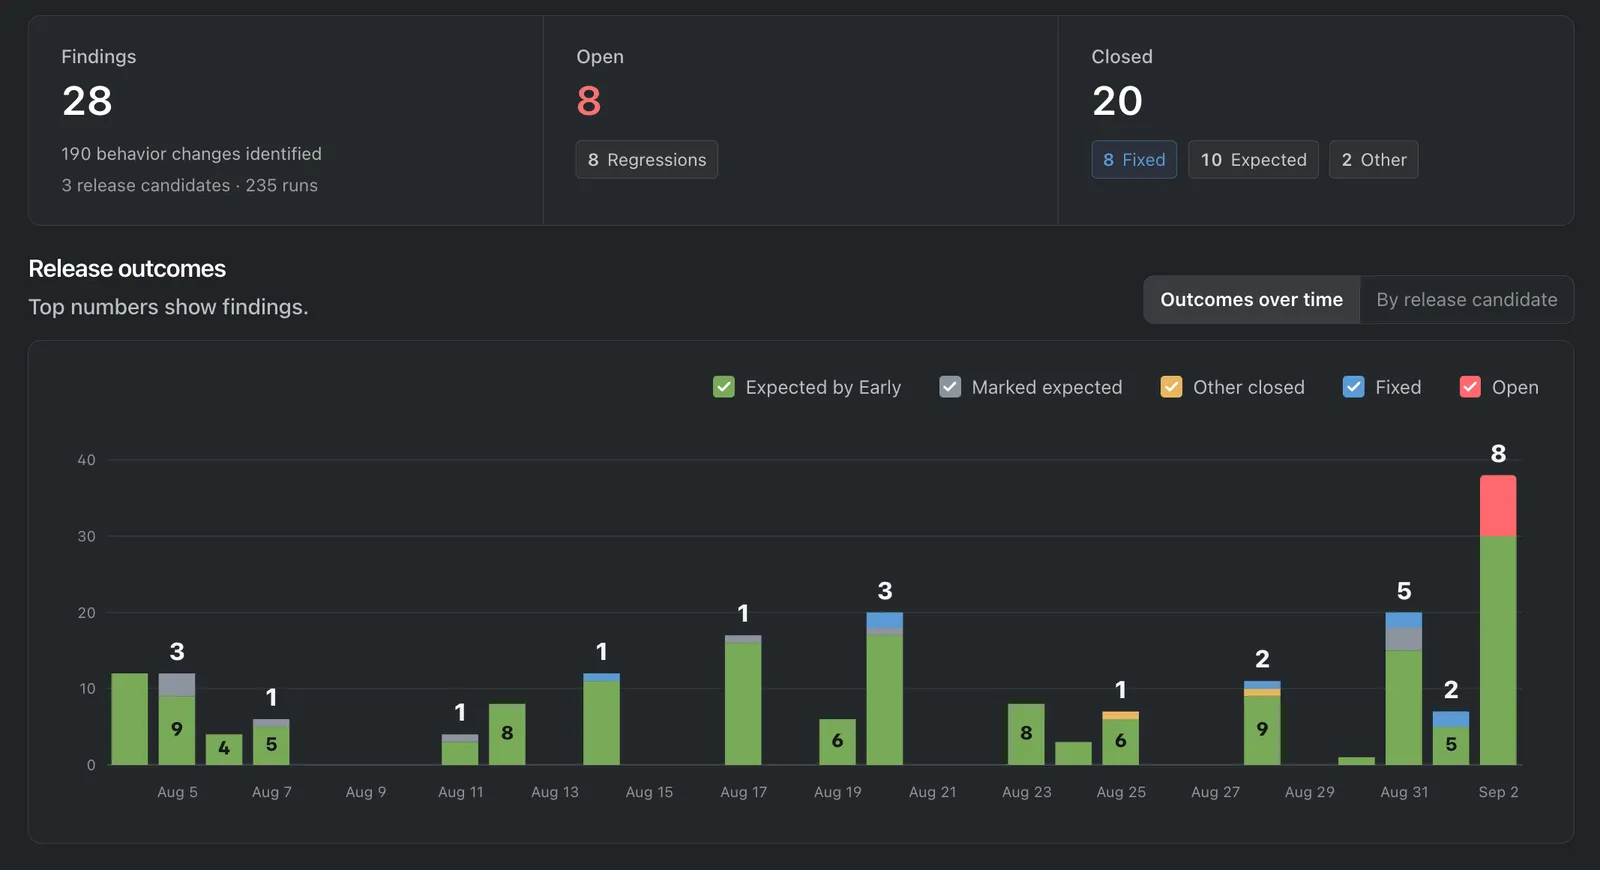
Illustrative Outcome report with one selected reporting scope.
The summary separates total findings, open regressions, and closed findings. The time view groups findings by when they were produced while showing each finding’s current outcome. The release-candidate view groups that same current outcome data by release. The transition history for an individual finding remains with that finding.
Three tabs let a reviewer move through the same report at different levels:
- Release candidates compares status, run volume, and outcomes by release.
- Projects groups the report scope by project so reviewers can compare the repositories or services represented.
- Findings opens the individual records behind the totals.
Filters narrow the report to selected releases, include closed releases or ad hoc runs, and set the reporting period. Once the scope is right, the report can be exported as PDF or Markdown. A reviewer can also copy a link with the current filters or bookmark the view in the browser.
This makes the Outcome report useful in two moments. Before a release decision, it shows what remains open. After findings have been reviewed, it shows the current mix of fixed and other closed outcomes alongside anything unresolved.
Understand the activity behind the review
The Usage report answers a different question: how was Regression Guard used during the selected reporting period?
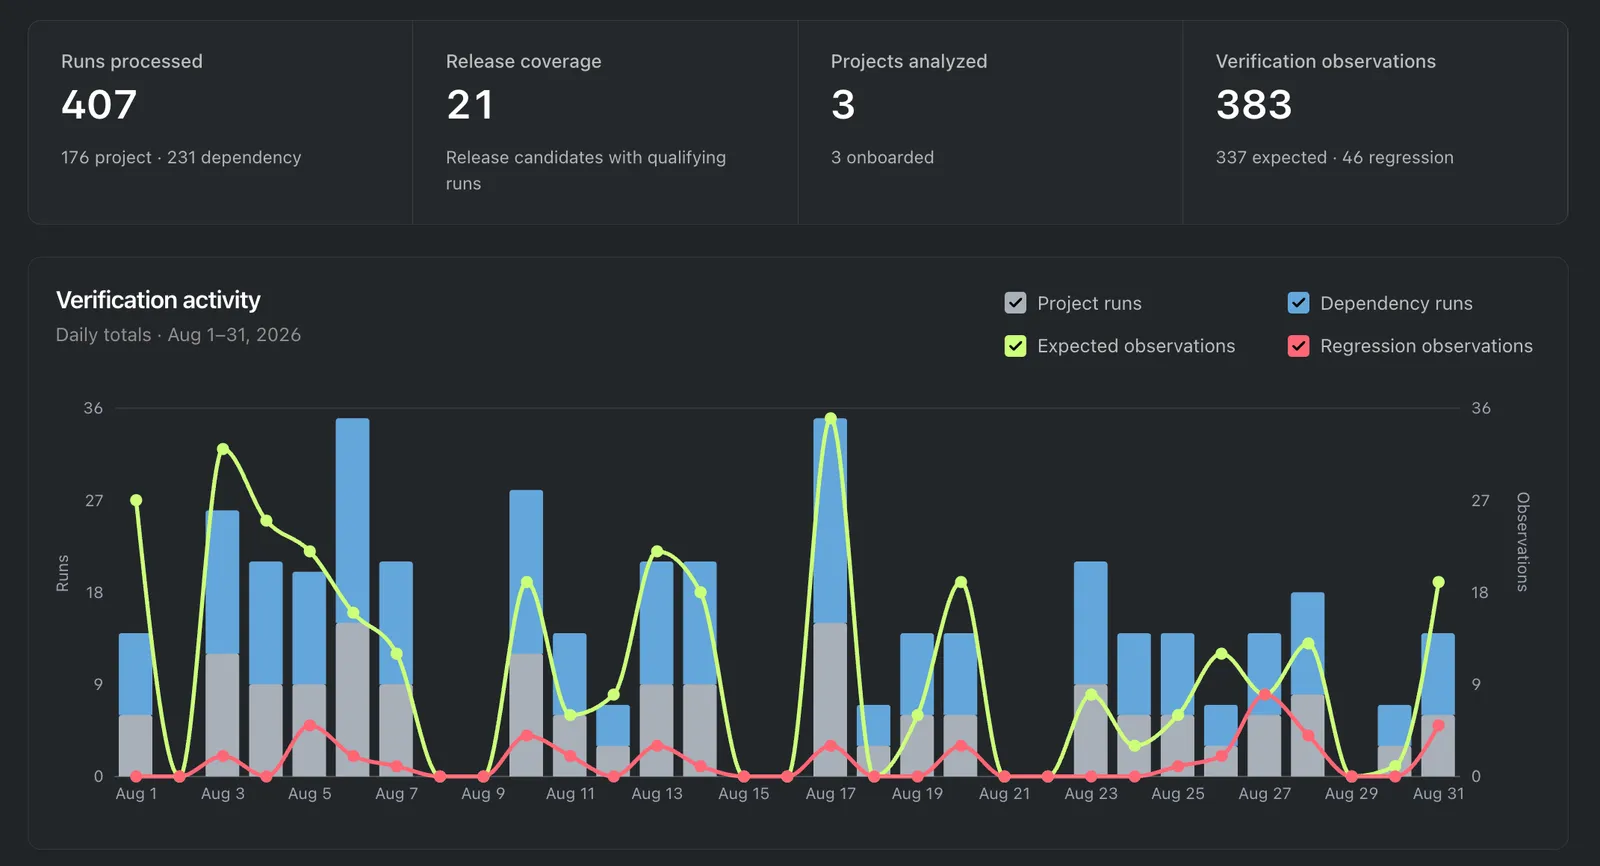
Illustrative Usage report for a selected reporting period.
Its summary covers processed runs, release coverage, projects analyzed, and verification observations. The activity chart then shows how runs and resulting observations were distributed over time.
Reviewers can select a monthly period or a custom date range, then break the detail table down by release or by project. PDF export creates a readable summary. CSV export makes the aggregated report data available for audit, reconciliation, or spreadsheet analysis.
Usage data supplies context for a release review. It can show that analysis ran across the releases and projects in scope. A quiet period may mean there was no release work, or it may identify a gap in analysis that deserves investigation. Activity volume alone does not prove that a release is ready. That judgment still depends on the findings, their current outcomes, and the freshness of the analysis.
One review, three levels
The three surfaces are designed for different levels of the same conversation.
- Open Home to see where attention is needed today.
- Open Outcome to explain the regression risk and current finding outcomes.
- Open Usage to understand the verification activity behind the reporting period.
From there, a reviewer can move into the individual finding when a decision needs the full evidence and history.
This is the goal of the new release readiness dashboard and regression reports: make release conversations less dependent on whether someone thinks enough analysis happened, and more grounded in information the team can inspect together.
Frequently asked questions
What does the Early Regression Guard Home dashboard show?
It shows open regressions that need attention, readiness across active release candidates, recent finding outcomes, and whether release analysis is current.
What is the difference between the Outcome report and the Usage report?
The Outcome report shows findings from runs in the selected period with their current outcomes. The Usage report shows processed runs, release coverage, projects analyzed, and verification observations.
Does verification activity prove that a release is ready?
No. Usage data shows the analysis activity behind a review. Release readiness also depends on the findings in scope, their current outcomes, and how recently the release was analyzed.
About the author