Early Release Guard
Read the Usage report
The Early Release Guard Usage report shows how much verification activity Early processed during a selected reporting period. Use it to understand adoption, release coverage, and whether Release Guard is being run often enough to support release decisions.
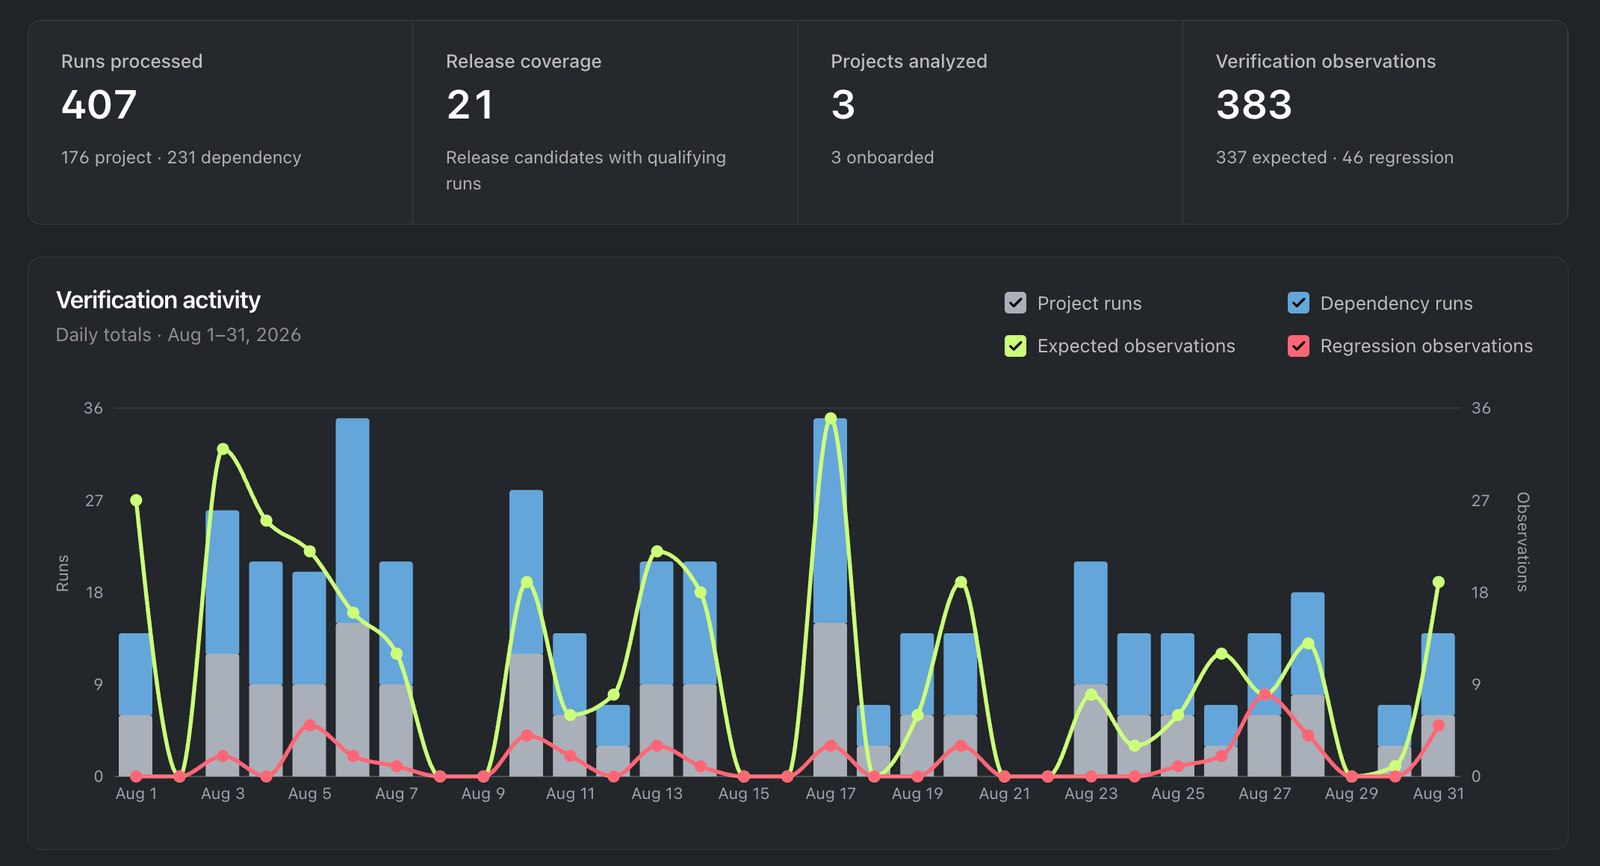
What this report answers
Use the Early Release Guard Usage report when you need to understand team adoption, release coverage, and verification activity across a reporting period. It answers four operating questions:
- How many verification runs were processed?
- How many release candidates had qualifying activity?
- How many projects were analyzed?
- How many verification observations did Early produce?
Summary numbers
The summary cards at the top show the main usage counts for the selected reporting period:
- Runs processed counts successfully processed verification results.
- Release coverage counts release candidates with qualifying activity.
- Projects analyzed counts projects included in processed analysis activity.
- Verification observations counts the observations produced by Early during that reporting period.
Use these numbers to explain whether a team is actively using Release Guard, and whether the current usage level covers the releases that matter.
Read verification activity
The verification activity chart breaks usage down over time. It separates project runs and dependency runs from expected observations and regression observations, so you can see both activity volume and what Early observed during that activity.
Use the chart to find gaps in usage. A quiet period can mean no release work happened, but it can also mean a team stopped running analysis before release review.
Select the date range
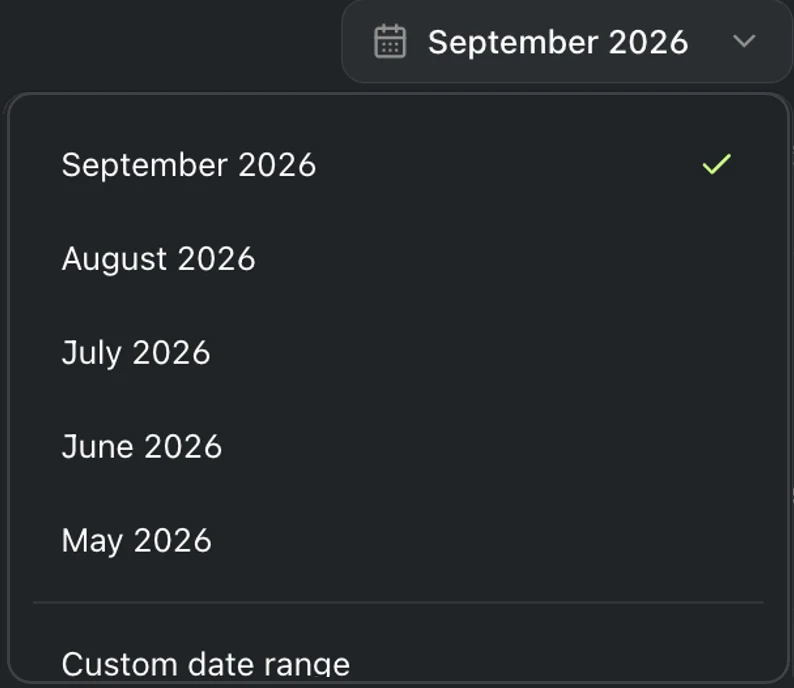
Use the date range control to choose the usage period you want to report on. The report supports monthly periods and a custom date range, which lets you align usage data to a release review, operating review, or internal adoption review.
When you change the period, the summary cards, verification activity chart, usage breakdown, and definitions stay in the same reporting context.
Review the usage breakdown
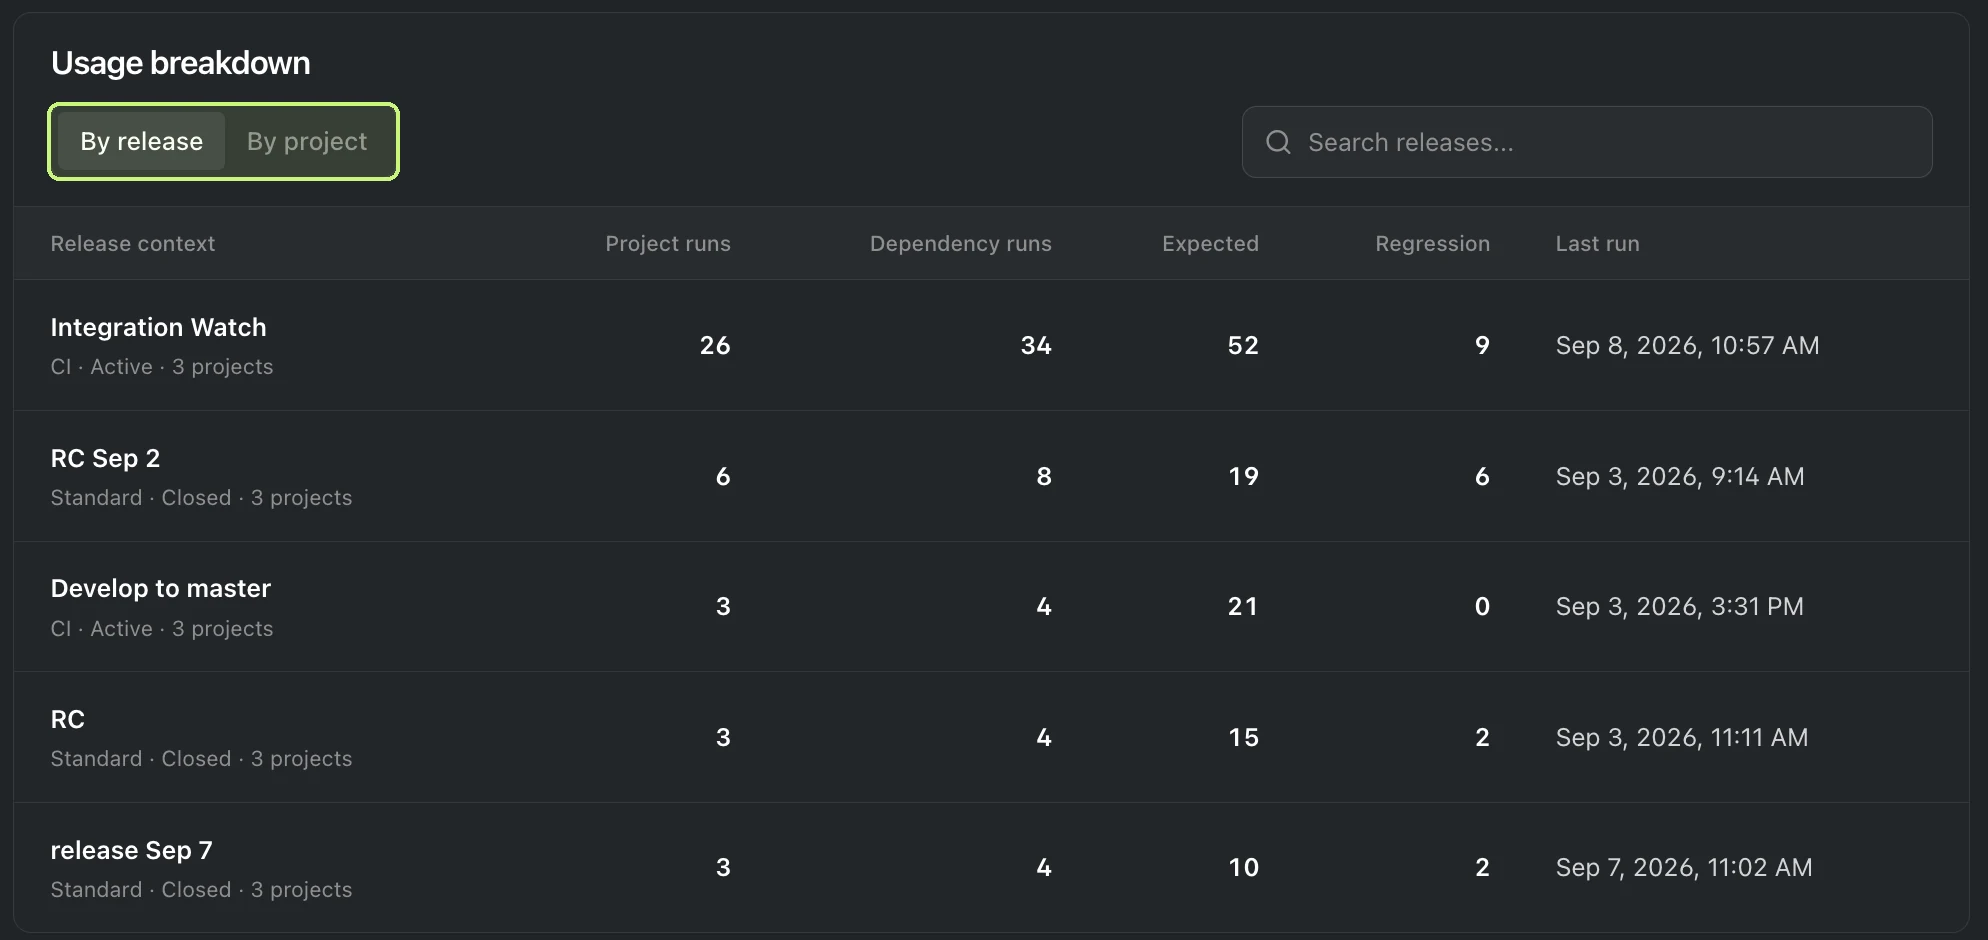
Use the Usage breakdown tabs to change how the detail table is grouped:
- By release groups usage by release context. Use it to see which release candidates or closed releases generated activity in the selected period.
- By project groups the same usage metrics by project. Use it when you need to understand which repositories or services contributed the activity.
The table shows project runs, dependency runs, expected observations, regression observations, and the latest run time for the selected grouping. Use search to narrow the visible rows without changing the selected date range.
Export a usage report
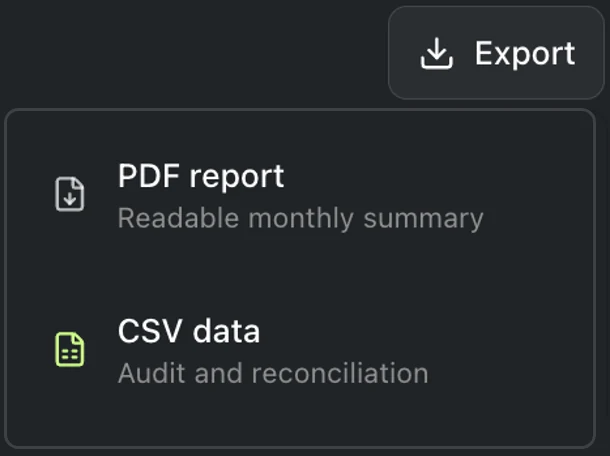
Use Export when you need to take the selected usage period outside Early:
- PDF report creates a readable monthly summary for release reviews, account updates, and internal status discussions.
- CSV data exports the underlying usage data for audit, reconciliation, or spreadsheet analysis.
Check counting definitions
The report also exposes the counting definitions used for the usage history, so a reviewer can understand what the summary numbers include before using the report in an external discussion.
Use it for adoption review
Use the Usage report alongside the Outcome report when you need both activity and results. Usage shows whether the team ran enough analysis during the selected period. Outcome shows what Early found and how the team handled those findings.