Early Release Guard
Read the Outcome report
The Early Release Guard Outcome report explains what happened to findings over time and across release candidates. Use it to review release risk, confirm closure progress, and prepare an outcome summary for stakeholders.
What this report answers
Use the Early Release Guard Outcome report when you need to explain release readiness and the state of regression risk across one or more release candidates. It answers four practical questions:
- How many findings did Early report in this scope?
- How many findings are still open?
- How many findings were closed, fixed, or marked expected?
- Which release candidates contributed most to the outcome trend?
Summary numbers
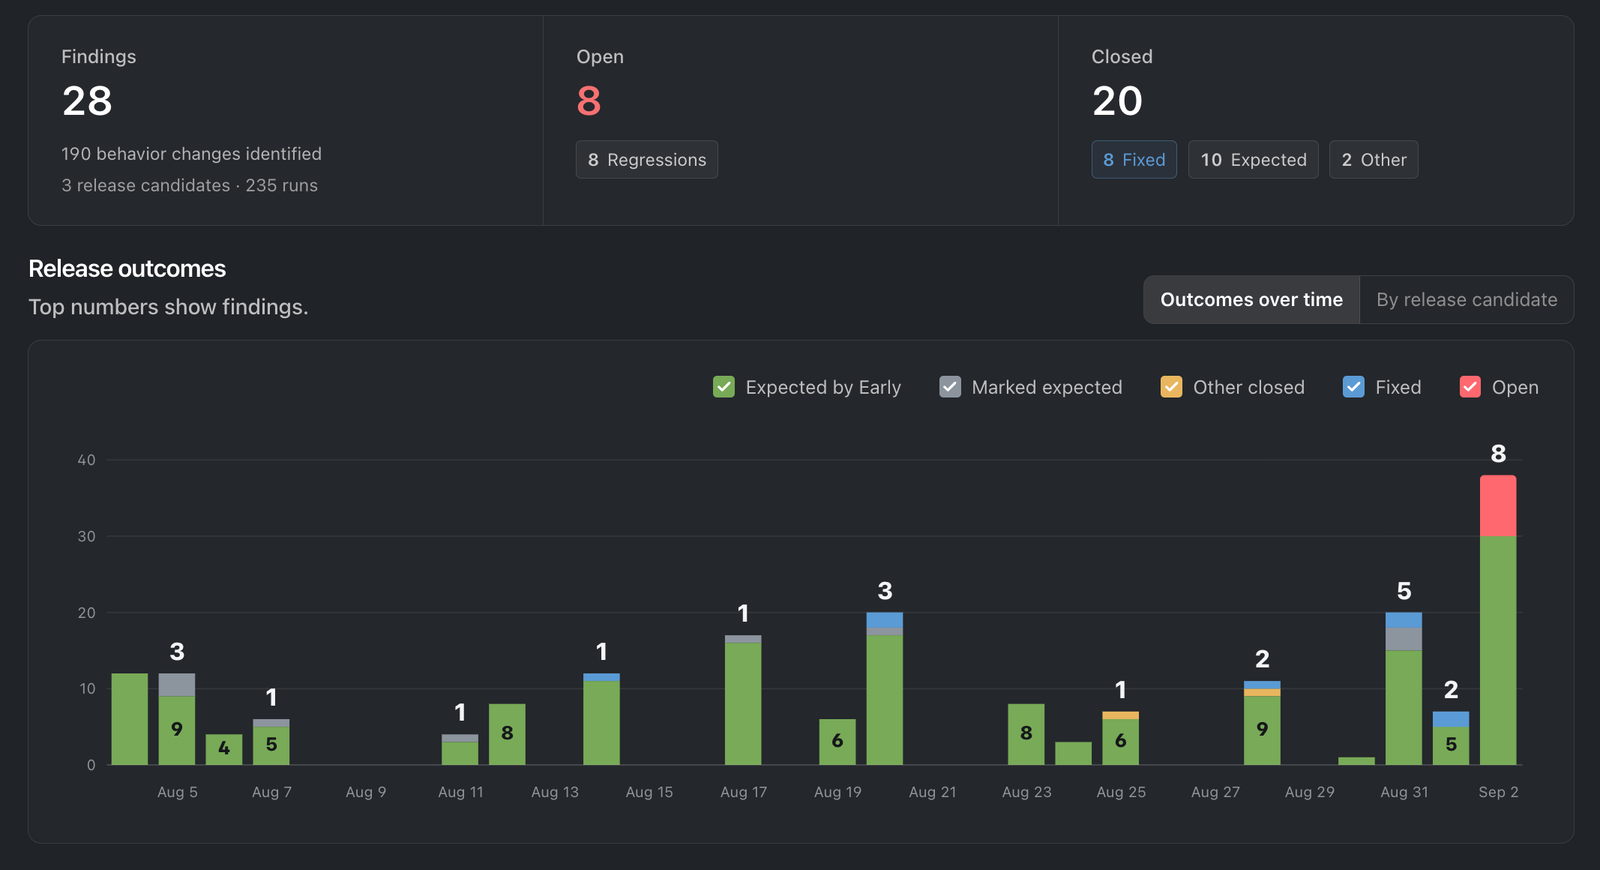
The summary cards at the top give the fastest read on the selected report scope:
- Findings is the total finding count in the selected period and release scope.
- Open is the count that still needs a decision or fix.
- Closed is the count that already has a closure outcome.
Use these numbers for the headline of a release review. If Open is still high, drill into the findings before treating the release as ready.
Read the chart
The release outcomes chart shows findings produced by runs in the selected period, grouped by their current outcome. The legend separates open findings from closed outcomes, including fixed findings, findings marked expected, findings Early classified as expected, and other closed reasons.
Switch the chart view when you need a different comparison. The time view is useful for spotting trend changes, while the release-candidate view is useful for finding which release contributed the most open or closed findings.
Switch report views
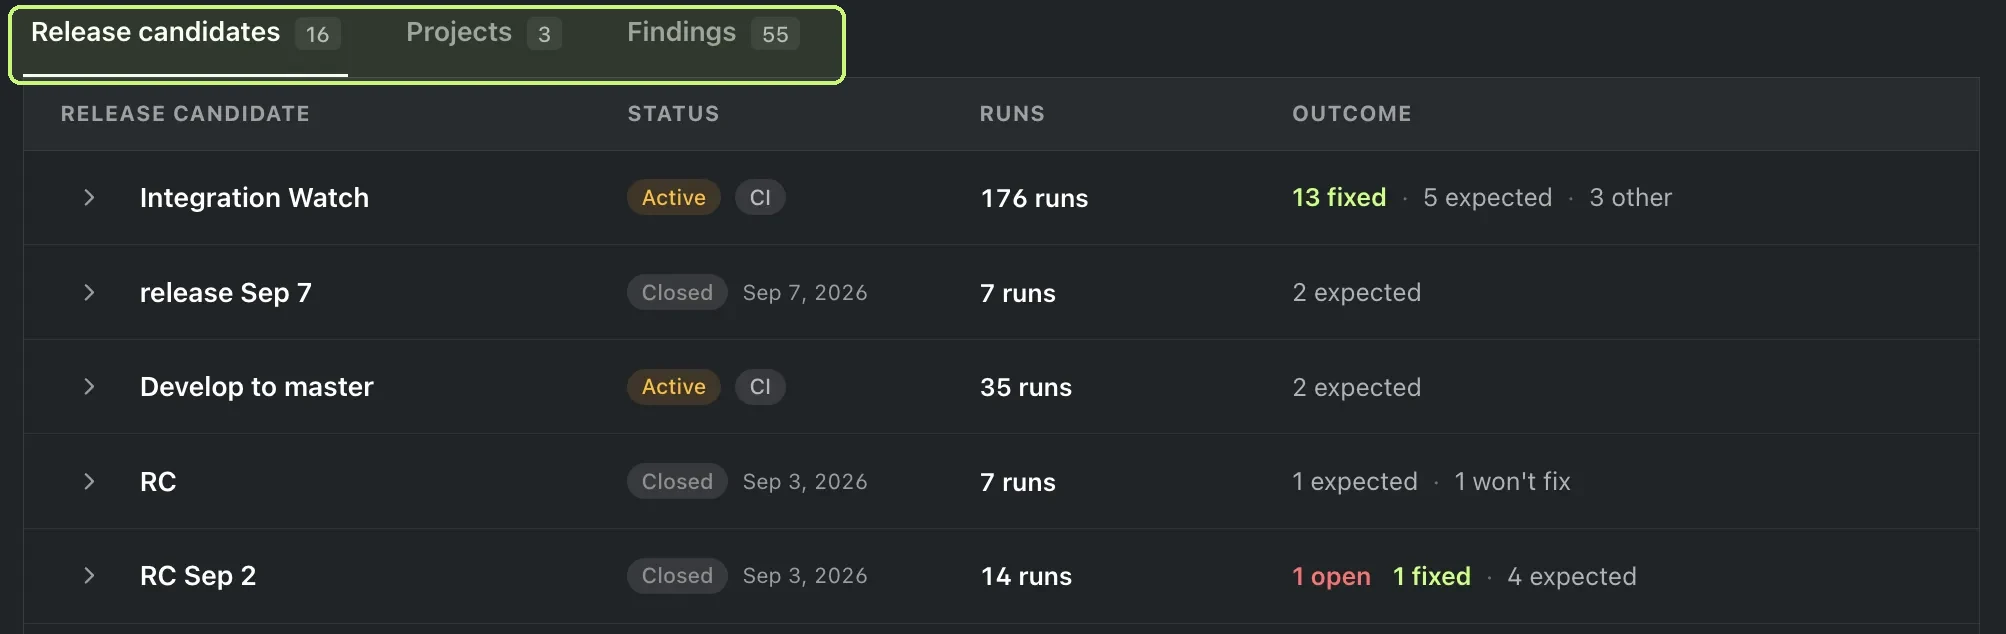
Use the report tabs to change the detail table below the outcome summary:
- Release candidates groups outcomes by release candidate. Use it to compare active and closed releases, run volume, CI status, and closure outcomes.
- Projects groups outcomes by project. Use it when you need to see which repositories or services contributed most to the selected report scope.
- Findings lists the individual findings behind the totals. Use it when a review needs finding-level decisions, owners, or links.
The count beside each tab shows how many release candidates, projects, or findings match the current scope. The filters below update all three views together.
Filter the scope

Use the filter row to decide which release outcomes the report should include before you read the summary cards, chart, or breakdown.
- Release opens the release filter so you can review all releases or narrow the report to specific release candidates.
- Closed releases includes closed release candidates in the report scope when it is selected.
- Ad-hoc runs includes ad-hoc analysis activity when it is selected.
- Last 30 days controls the reporting period shown in the current view.
Narrow the scope when you are reviewing one release candidate. Broaden it when you need to compare several releases or explain how the team’s regression outcomes are changing over time.
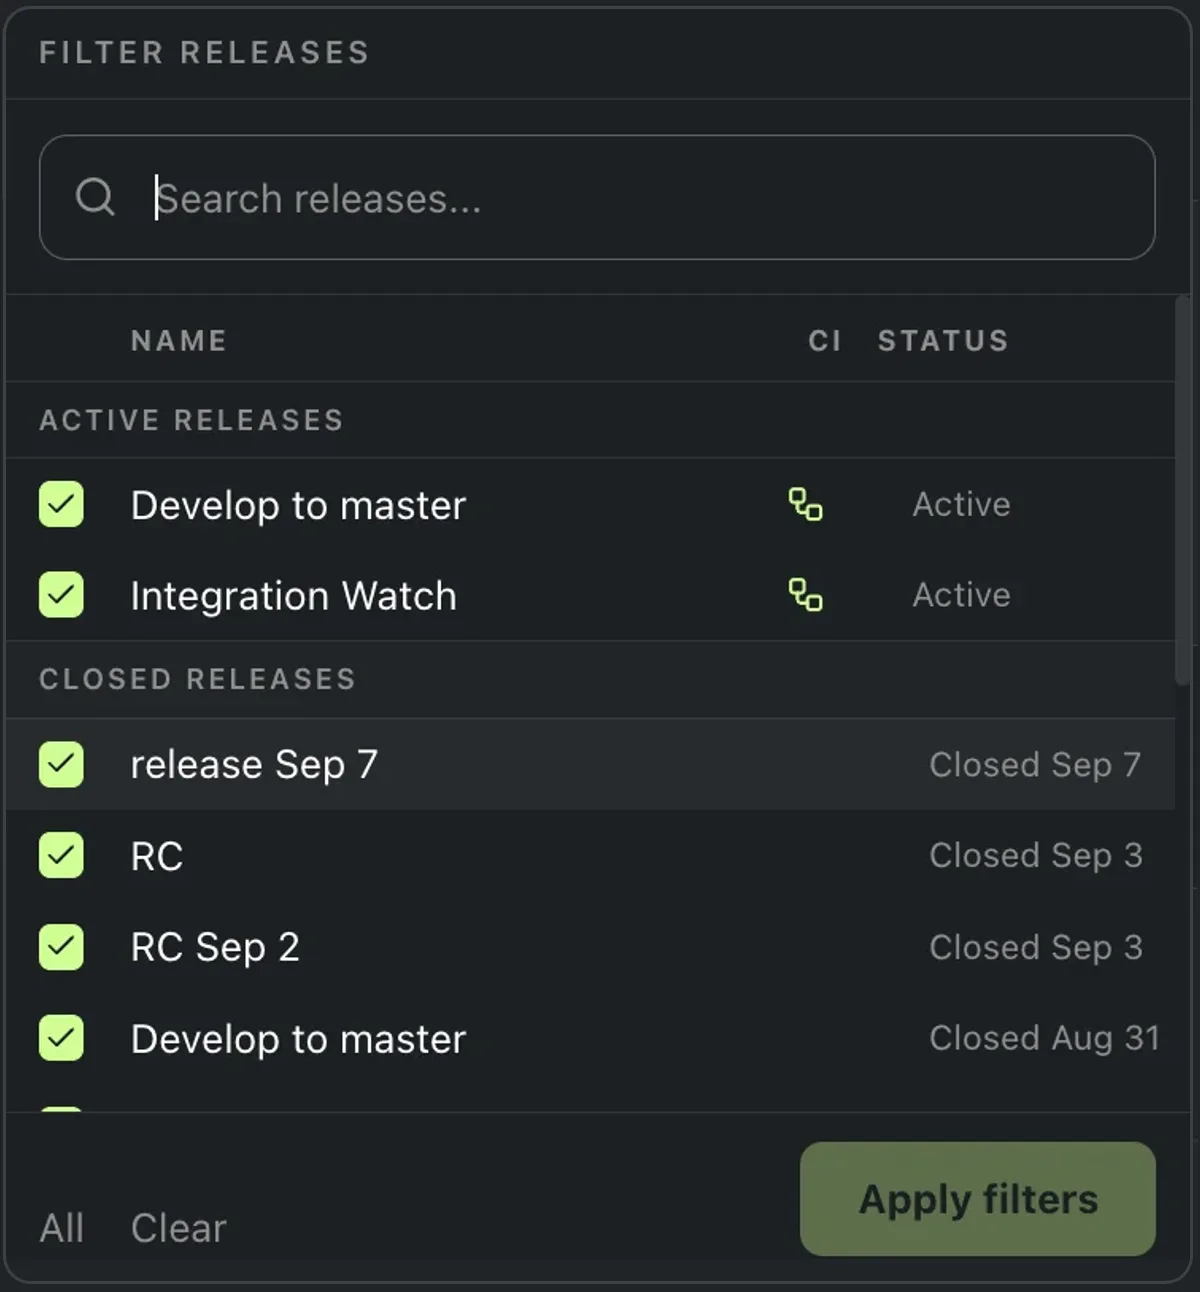
Inside the Release filter, search for a release candidate by name or select from the grouped Active releases and Closed releases lists. Use All or Clear for bulk selection, then Apply filters to update the report.
Export a report
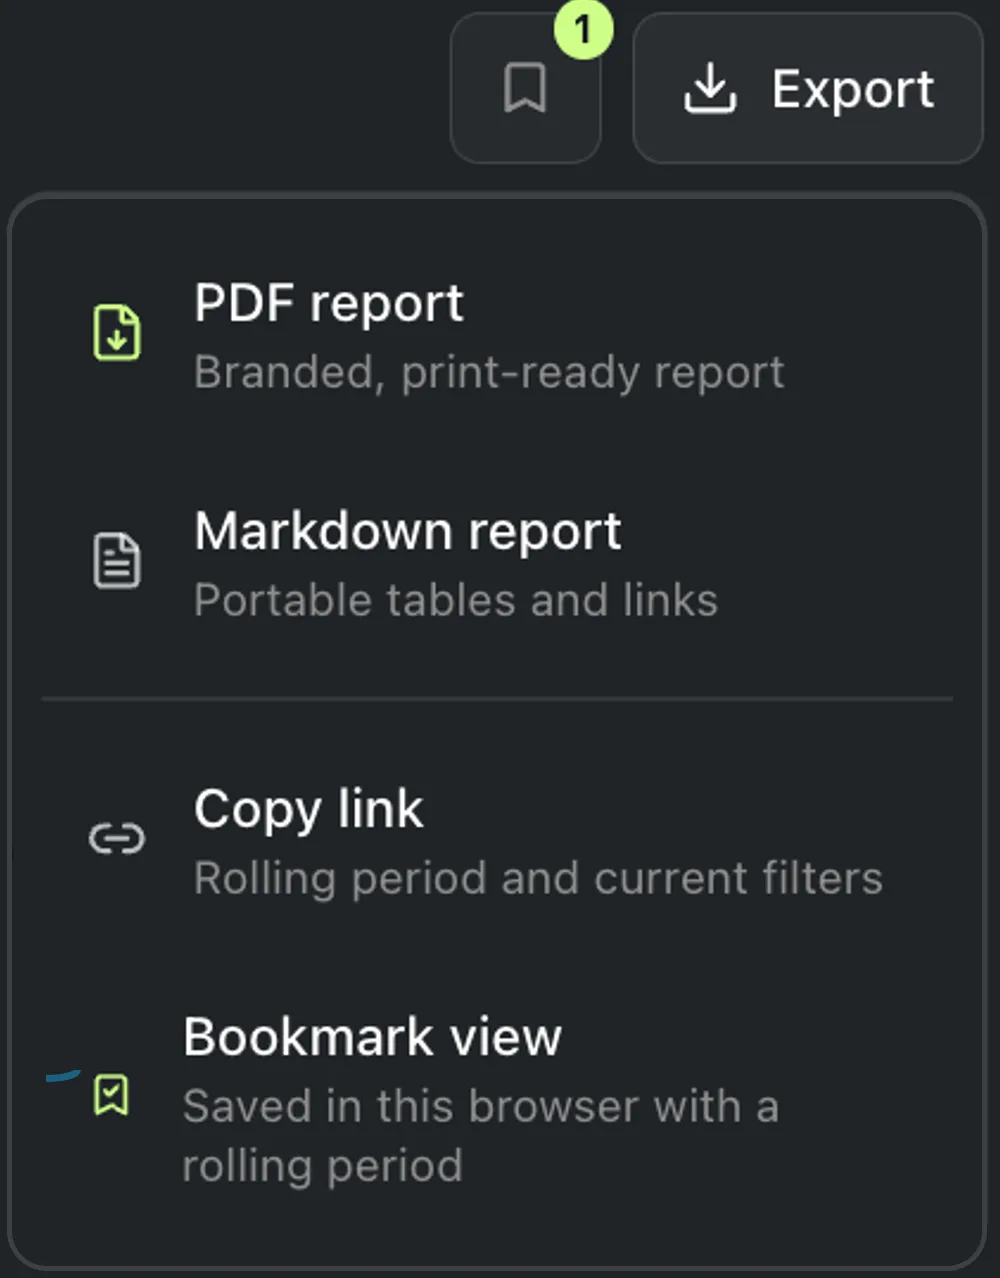
Use Export after the filters match the outcome view you want to share.
- PDF report exports a branded, print-ready PDF file.
- Markdown report exports a portable Markdown file with tables and links.
- Copy link copies a link with the rolling period and current filters.
- Bookmark view saves the current view in this browser with a rolling period.
Use PDF when the audience needs a polished report. Use Markdown when the audience needs the data in a format they can paste into an issue, document, or release note. Use Copy link when someone else needs the same filtered view. Use Bookmark view when you want to reopen the same Outcome report from this browser. When saved views exist, the bookmark button shows how many views are saved.
Use it in review
For a release review, start with the summary cards, then use the chart to explain the shape of the risk. If open findings remain, continue to Review your regression findings and close or assign them before making the release decision.