Early Release Guard
Use the Home dashboard
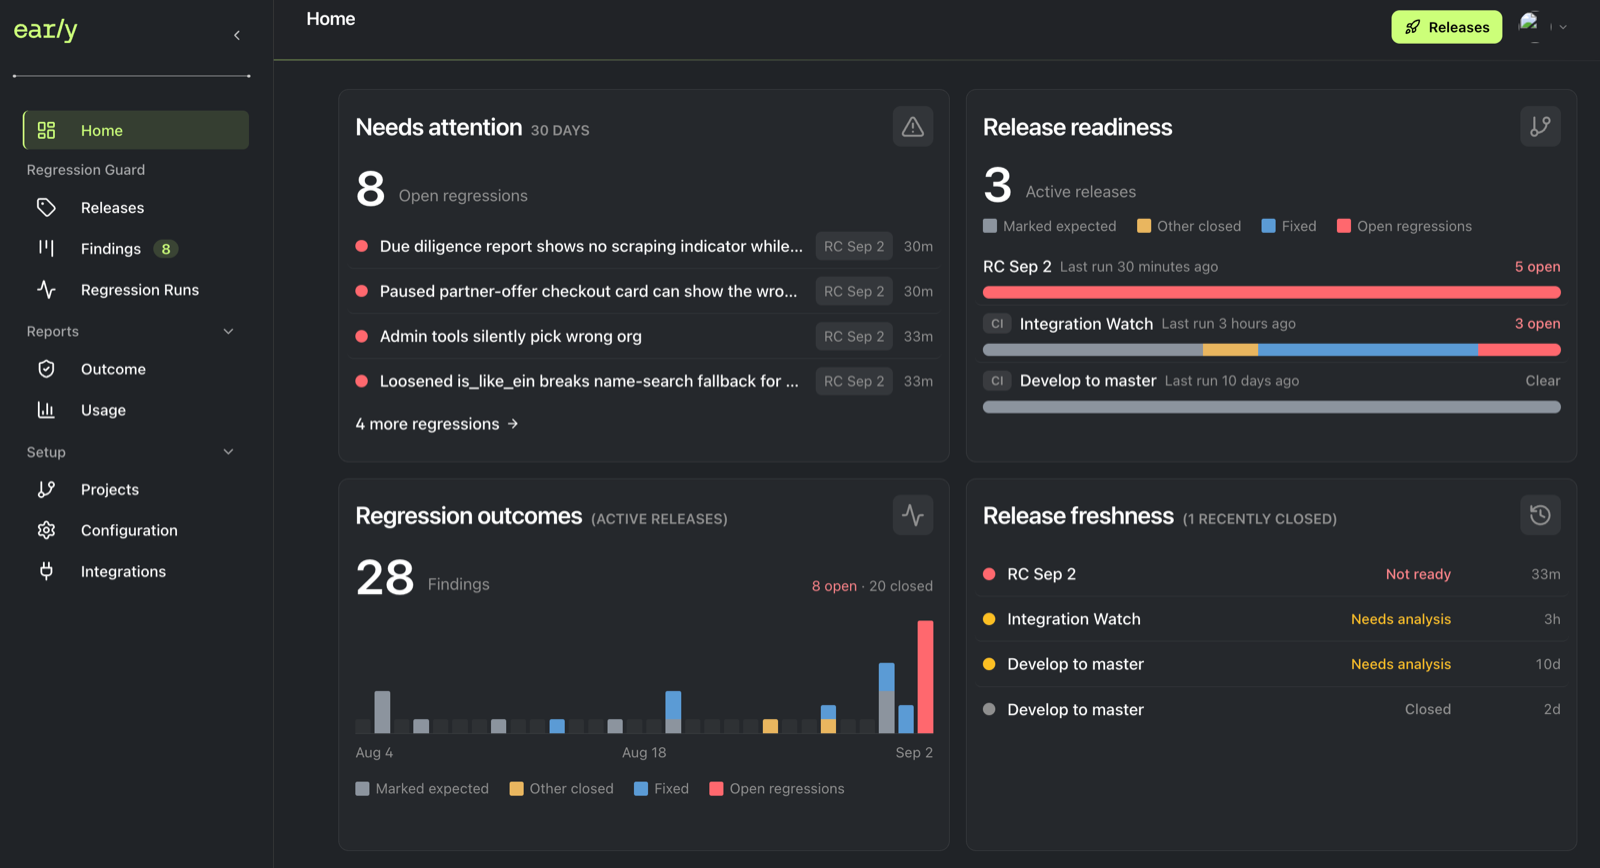
Home is the daily overview for Early Release Guard. It shows what needs attention, which active releases are ready, how findings are trending, and which releases may need another analysis.
What this shows
The Home dashboard summarizes the current state of your Early Release Guard workspace across the team’s operational reporting window. Use it before release review to see whether new decisions are waiting, whether active release candidates are ready, and whether recent analysis results are fresh enough to trust.
The default reporting window is configured in team setup as the Operational reporting window. When that configuration changes, the attention list, readiness summary, outcome trend, and freshness view use the same operational window so the panels stay in the same time context.
Needs attention
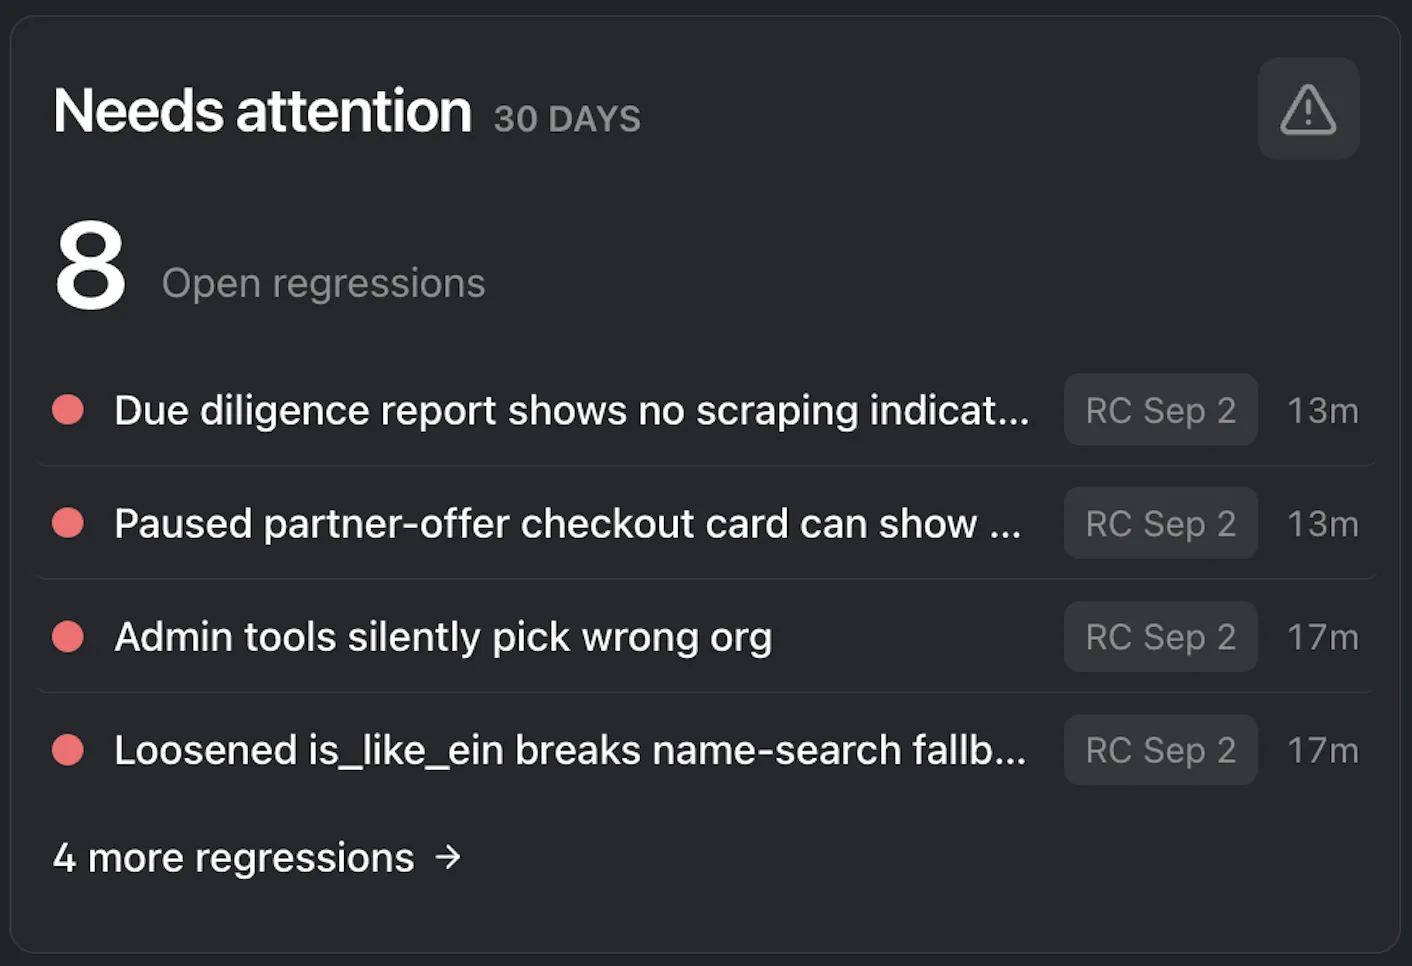
Needs attention lists open regressions that still require a decision or a fix. It is the fastest place to find unresolved work because it groups the current open findings before you drill into a specific release candidate or finding.
When the panel shows open items, use it as the starting point for triage. Open the finding, decide whether it is expected, close it with the right reason, or route it to the owner who can fix it.
The large number is the open-regression count for the operational reporting window. Each row shows the finding title, the release candidate it belongs to, and how recently Early observed it. If there are more open findings than fit in the panel, the footer link opens the rest of the attention queue.
Release readiness
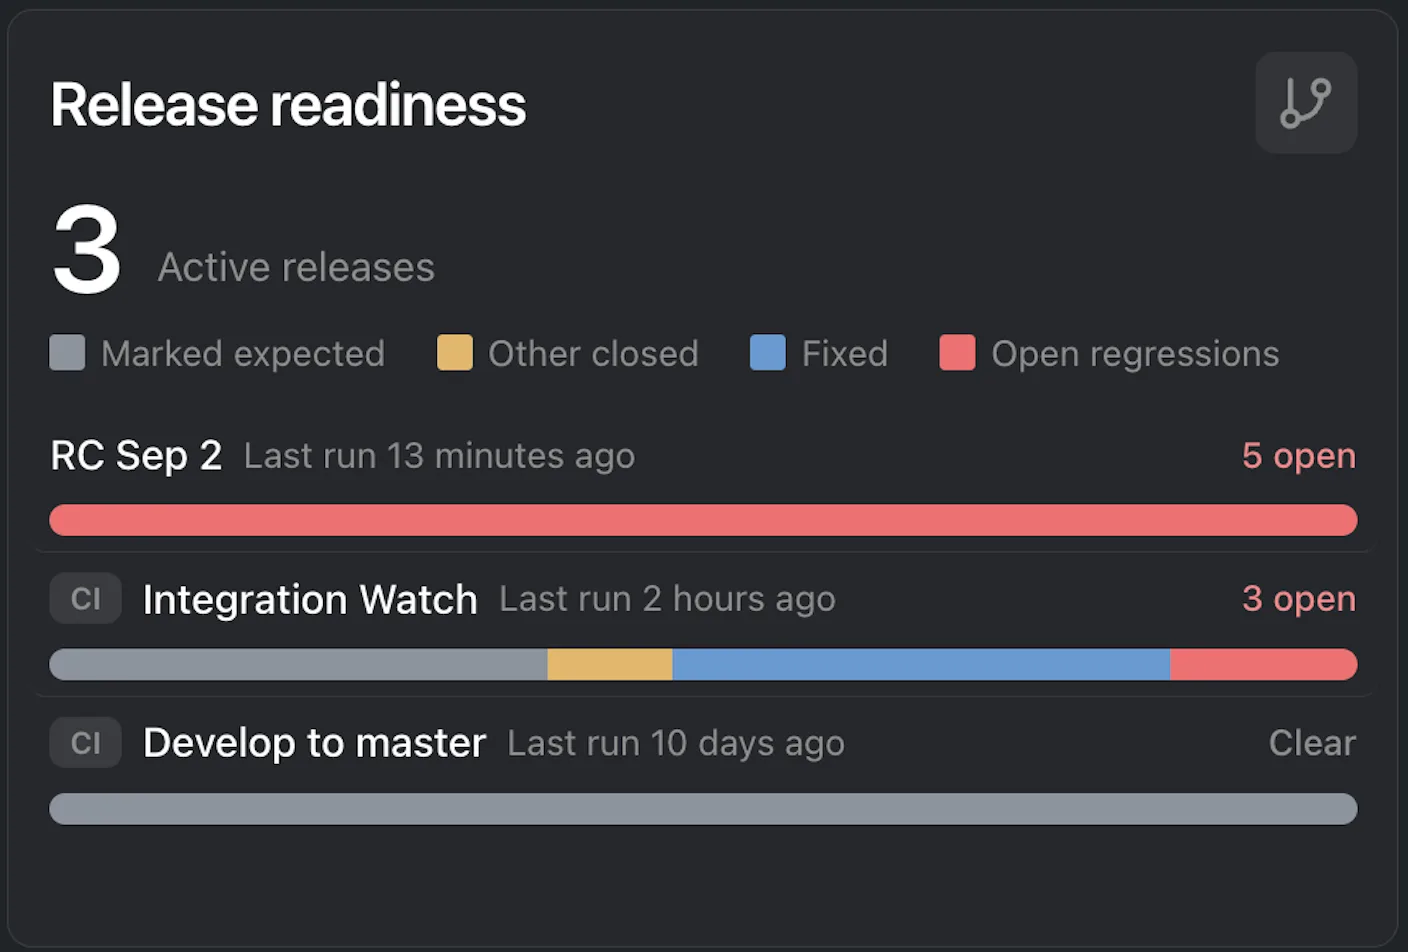
Release readiness shows active release candidates and their latest observed status. The summary helps you see how many active releases are ready, blocked by open regressions, or still waiting on analysis.
Each release row includes its latest run context. Use this panel when you need a release-level answer before looking at individual findings.
The release bar shows whether open regressions remain for each release. Red means open regressions still need review. Blue means findings were closed as fixed. Yellow means findings were closed for another reason. If there is no red in the bar, the release has no unresolved open regressions in this view, but still check the latest run time before making a release decision.
Regression outcomes
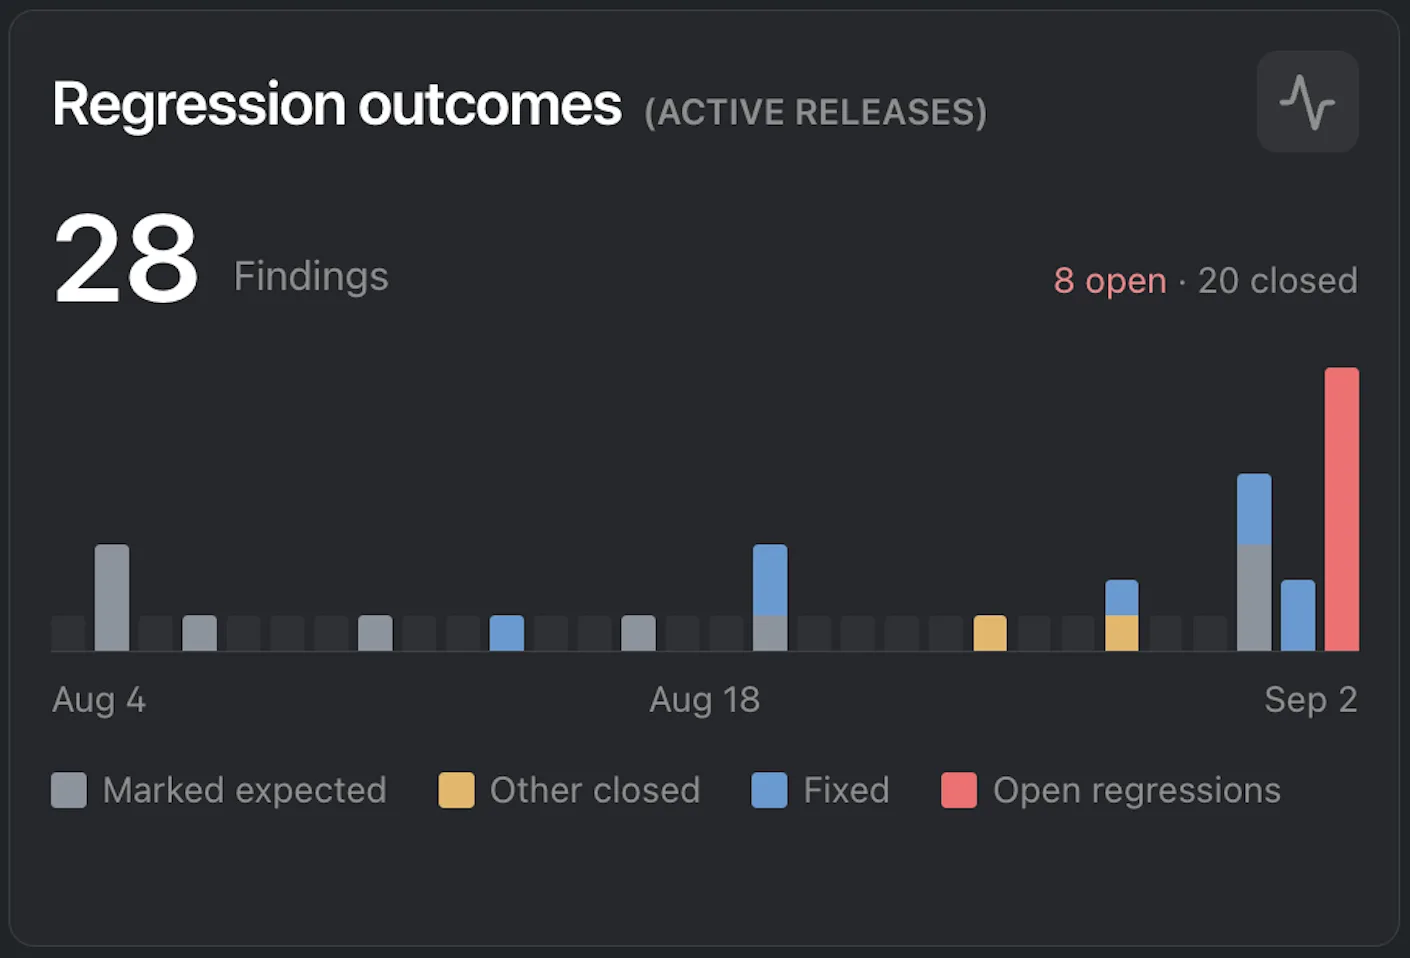
Regression outcomes shows how findings are distributed across active releases in the operational reporting window. The chart separates open regressions from closed outcomes such as fixed, expected, and other closed states.
Use this panel to spot whether the team is closing findings as fast as Early discovers them, and whether new regression volume is trending up or down.
Read the headline count first, then compare the open and closed totals. The bars show when findings appeared and their current outcome mix. A late red spike means recent release work created open regression risk that still needs review.
Release freshness
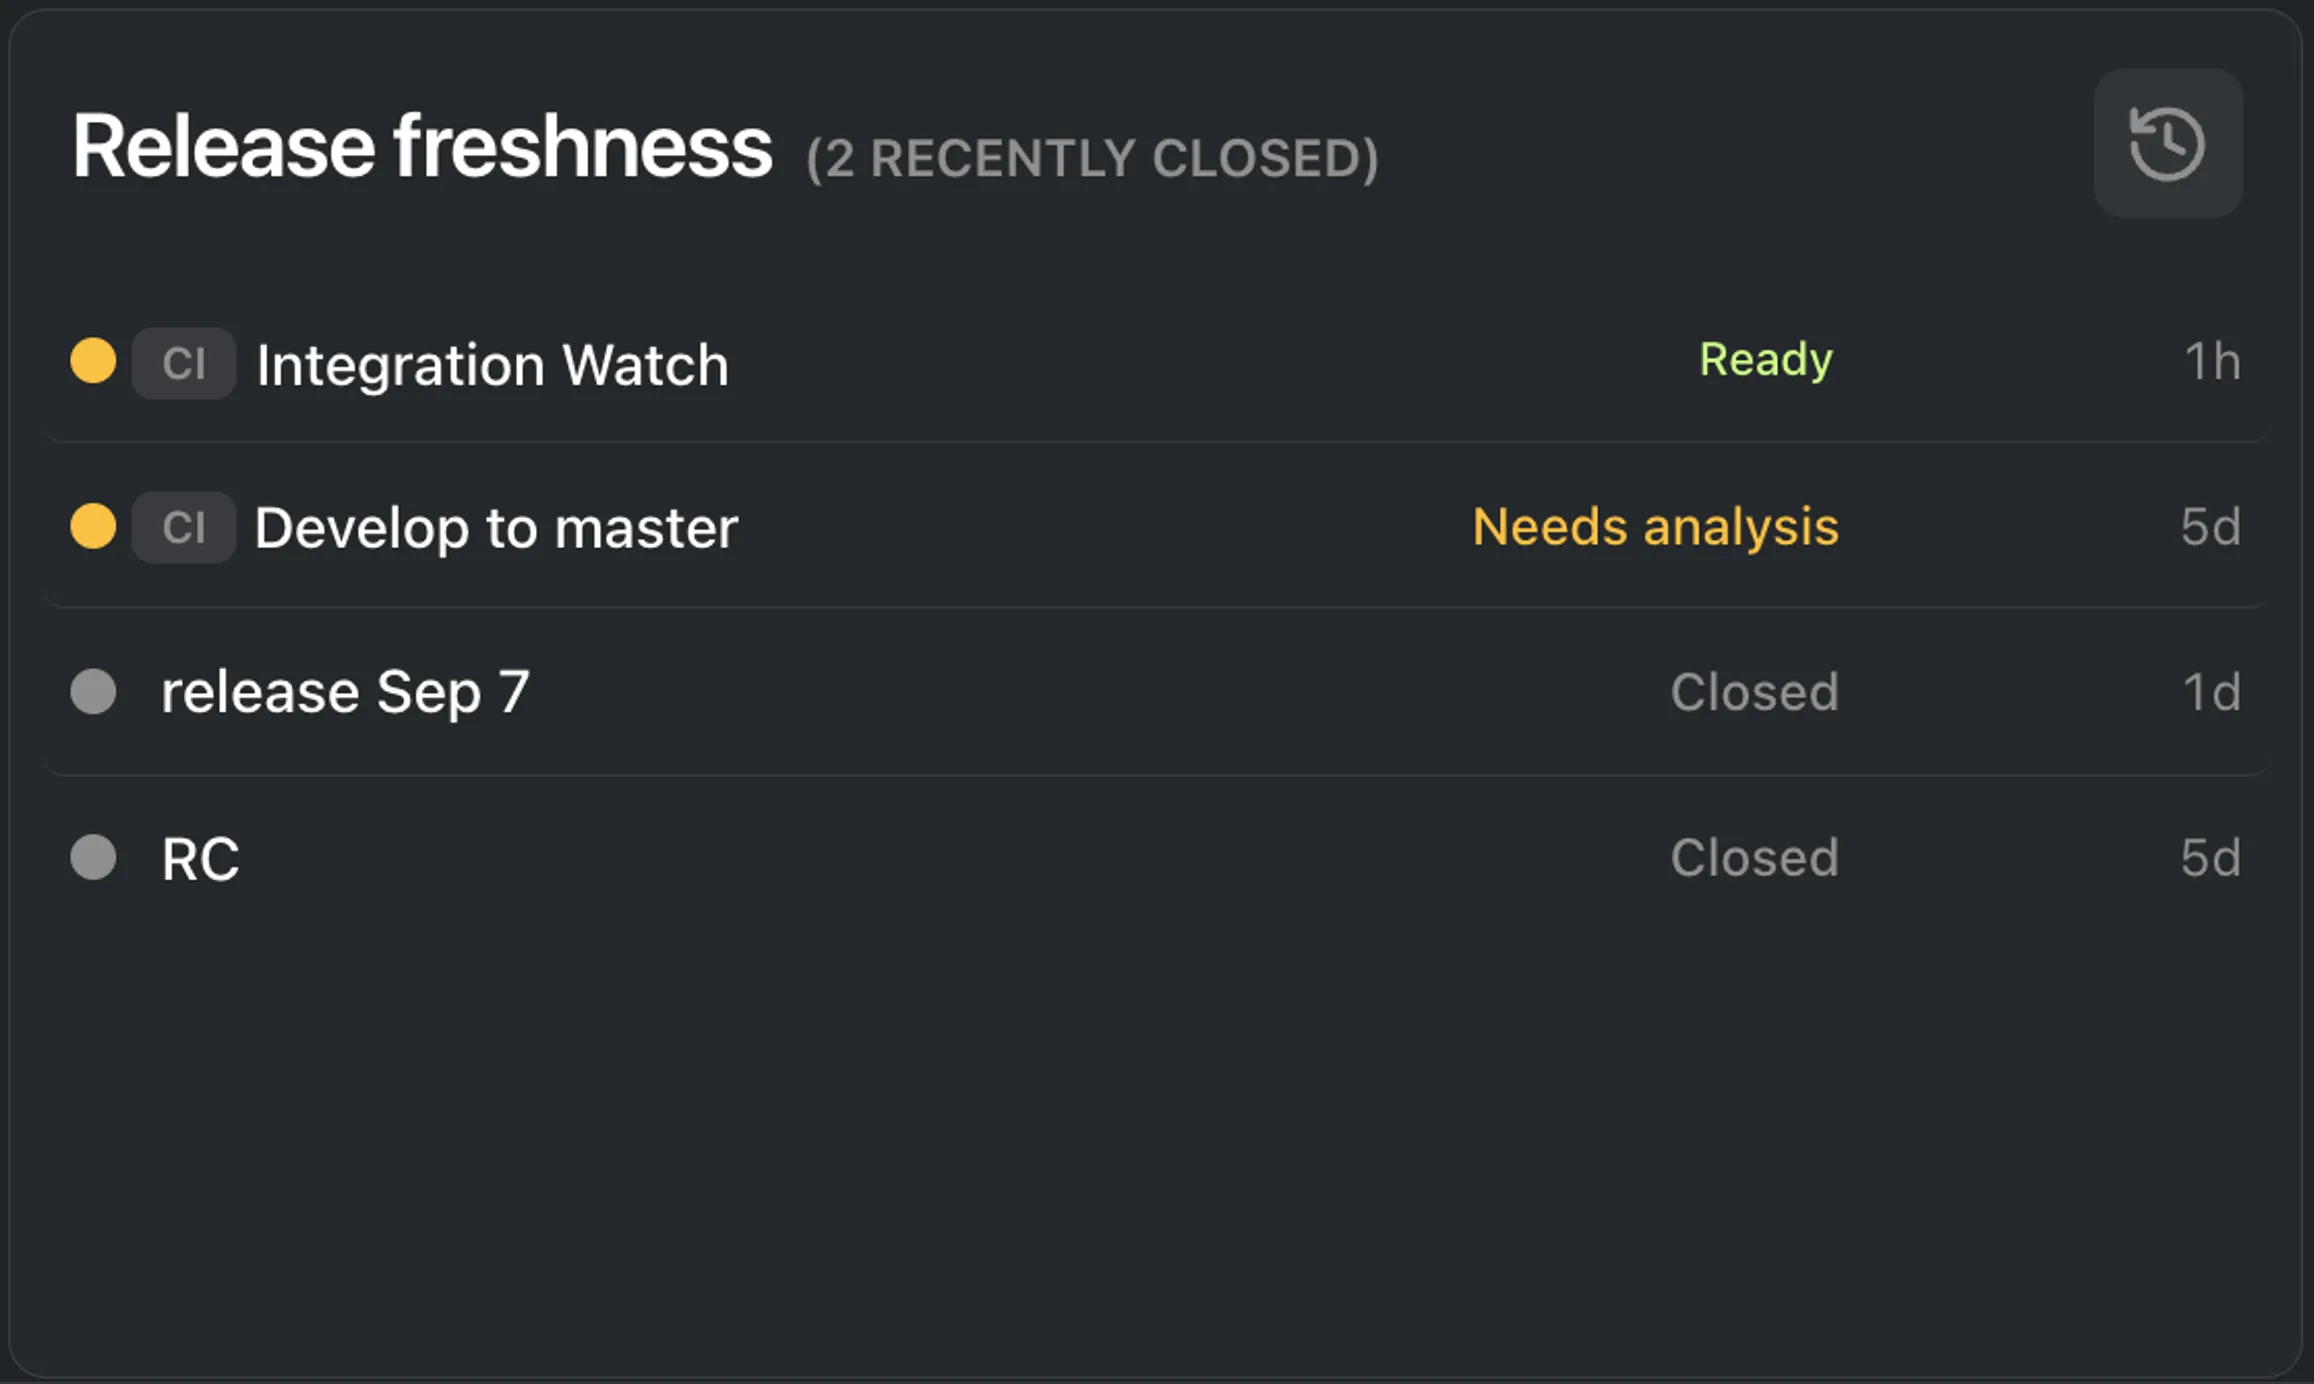
Release freshness shows active and recently closed releases by their latest analysis activity. It helps you catch release candidates whose last result is old, missing, or no longer representative of the current code state.
Use this panel before relying on an older release result. If a release looks stale, run analysis again before making a release decision from that result.
The state label explains whether the release is ready to use as evidence. The age on the right shows how long it has been since that state changed or since Early last observed the result. A release marked Needs analysis should be analyzed before you treat the dashboard as current.
Change the reporting window
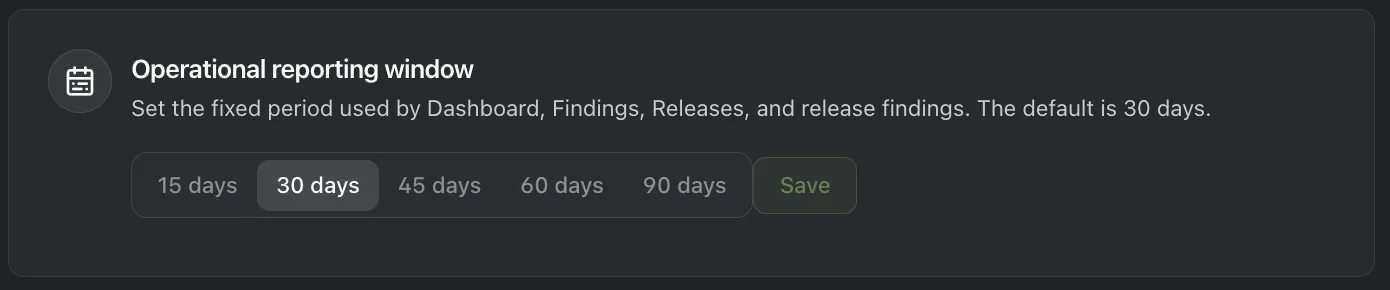
The Home dashboard uses the team’s Operational reporting window. To change the default period, go to Configuration, open Team setup, and update Operational reporting window.
The default is 30 days. Choose 15, 30, 45, 60, or 90 days, then Save. After the setting changes, the dashboard, findings, releases, and release findings use the same operational window.
Next
Use the Outcome report for deeper release outcome trends, the Usage report for coverage and verification activity, or Review your regression findings when a specific finding needs a decision.